Project
EF45-4
Hybrid Models for Large Scale Infection Spread Simulations
Project Heads
Tim Conrad, Kai Nagel, Christof Schütte
Project Members
Kristina Kehrer
Project Duration
01.01.2024 – 31.12.2025
Located at
ZIB
Description
In this project, we developed a hybrid model that accurately simulates infection spread and the impact of counter-measures. The innovative model couples Agent-Based Models (ABM) with Ordinary Differential Equation (ODE) and Partial Differential Equation (PDE) models, and offers high computational efficiency and precision in modelling large regions.
In the previous project EF4-13, we coupled PDE and ODE models to simulate infection dynamics in Lombardy, Italy. We conducted additional experiments on a rectangular domain using synthetic populations to test the robustness of the model (see Figures A, B, C), and we selected a more detailed representation of Berlin’s population (see Figures D, E). We decided to maintain a coarse representation of the initial population, similar to our previous experiments in Lombardy, rather than modeling each household individually. This approach proved to be effective.
In the current project EF45-4, we explored methods for coupling ABMs with PDE models. Going a step further, we also tackled the problem of coupling ABMs, PDEs, and ODEs, which ultimately means handling nine different transmissions between model types. We applied this approach to Germany by assigning each state one model type.
First, we return to our paper on hybrid ABM-PDE models. We chose Brandenburg as the simulation area for the ABM and Berlin for the PDE model. This decision was based on the fact that 1) Brandenburg has fewer residents than Berlin and 2) Berlin’s population is more evenly distributed. We had access to trajectories of individuals from Germany who had been in Brandenburg and Berlin at least once — on a weekday, Saturday, and Sunday. From these trajectories, we derived a landscape. Using a mobility ABM with this landscape, we incorporated various health statuses to simulate infection dynamics. Most parameters were taken from the literature [2]. For the infection model, we adopted the probability for an agent to become infected from [2], which considers various activities within buildings, making transmission dependent not only on agent coordinates but also on the type of activity, such as home, work, or leisure. Additionally, the model estimated factors like room size and air exchange rate for these different activity types.
After that, we derived a stochastic PDE model with zero-mean noise [1] from the established ABM and further simplified this model to a PDE model. In contrast to the ABM, implementing the infection dynamics in the PDE model was more difficult, as the ABM’s infection process depended on numerous factors — such as shedding and intake rates, duration of interaction with infected agents, contact intensity, a calibration parameter corresponding to the infection rate in a compartmental model [2], and daily activity change rates — some of which varied over time and across different facility categories. The implementation of activity reductions had the desired effect of reducing infection numbers, resulting, e.g., in a lower infection rate in the PDE system. For this reason, we directly incorporated changes in activity participation into the infection rate. School closures were handled differently, as they typically occurred over a clearly defined time interval, leading to a more pronounced impact. Rather than scaling the infection rate or adjusting it to the changed landscape, we divided the simulation time interval into two phases — one without school closures and one with school closures — and fitted the infection rates separately for these subintervals. All other transition parameters were assumed to be the same across the ABM and PDE model.
Coupling
The coupling between the ABM and PDE components was implemented by dynamically exchanging individuals between the two model domains. To ensure well-posedness of the PDE system and avoid artificial fluxes across the boundary, we imposed zero Neumann boundary conditions for the PDE contribution of the hybrid model across the entire boundary.
Agents Entering the PDE Domain
When an agent leaves the ABM domain and enters the PDE domain, the agent is removed from the ABM and their contribution is added to the PDE model. The agent’s health state is read and used to place them into the corresponding compartment of the PDE system. This procedure ensures consistent mass transfer across the model boundary and preserves the total population in the hybrid model. Adjusting the density of each compartment across the entire grid can be interpreted as new initial conditions for the system, which is then solved repeatedly over the entire simulation period.
Persons from PDE Domain Entering the ABM Domain
To simulate agents transitioning from the PDE domain (Berlin) into the ABM domain (Brandenburg), we precomputed the expected number of individuals present in the PDE model for each hour of the day. If the time step corresponded to one hour, this allowed us to determine how many individuals should leave the PDE model and be represented as agents in the ABM. For smaller time steps, we interpolated these values accordingly. When an individual entered the ABM domain, we randomly picked a free agent ID, and the corresponding plan from the mobile phone-based event data was activated. This plan defined the agent’s activities and locations for the current day. Occasionally, the agent’s first or final position from that plan might be inside Berlin, i.e. outside of the ABM domain.
Additionally, the health status of the departing person had to be determined. Their health status was not sampled stochastically but determined deterministically based on the current distribution of the PDE compartment densities. Instead of drawing random health states, we computed the ratio of individuals to be removed from each compartment, proportional to their current densities. These initial ratios were adjusted so that we ended up rounding down to whole individuals. Any remaining individuals were assigned to the susceptible compartment, which dominates the distribution. These ratios were then used to proportionally reduce the corresponding densities at each grid point, ensuring that more individuals were removed where the density was higher.
The coupling of ABM-PDE-ODE models followed the same principles as before, with the improvement that we stored the exact agent IDs of individuals leaving or re-entering a region, removed the rounding down of individuals in the case of jumps from non-ABM to non-ABM regions and agents were added as soon as possible upon entering an ABM domain and removed as late as possible upon leaving it. In non-ABM domains, they could contribute directly to the infection dynamics, whereas in ABM domains, they commuted without infecting others. The storage of agent IDs prevented assigning random trajectories that might have been suboptimal, even though duplicates were not possible. The PDE system with the landscape was reduced using the same technique as in the PDE-ODE paper. The coupling for ODEs were implemented analogously to the PDE case, except that no spatial integration over the domain was required. Preliminary results are visualized in Figures F, G, and H.
[1] Luzie Helfmann, Nataša Djurdjevac Conrad, Ana Djurdjevac, Stefanie Winkelmann, and Christof Schütte. From interacting agents to density-based modeling with stochastic pdes. Communications in Applied Mathematics and Computational Science, 16(1):1-32, January 2021.
[2] Sebastian Müller, Michael Balmer, William Charlton, Ricardo Ewert, Andreas Neumann, Christian Rakow, Tilmann Schlenther, and Kai Nagel. A realistic agent-based simulation model for covid-19 based on a traffic simulation and mobile phone data, 11 2020.
Project Webpages
Selected Publications
- Sebastian A. Müller, Michael Balmer, William Charlton, Ricardo Ewert, Andreas Neumann, Christian Rakow, Tilmann Schlenther, and Kai Nagel. Predicting the effects of covid-19 related interventions in urban settings by combining activity-based modelling, agent-based simulation, and mobile phone data. PLoS One, 16(10), 2021. DOI: 10.1371/journal.pone.0259037.
- Hanna Wulkow, T. O. F. Conrad, Natasa Djurdjevac Conrad, Sebastian Alexander Mueller, Kai Nagel, and Ch. Schütte. Prediction of covid-19 spreading and optimal coordination of counter-measures: From microscopic to macroscopic models to pareto fronts. PLoS ONE, 16(4), 2021. DOI: 10.1371/journal.pone.0249676.
- Kristina Kehrer, Martin Weiser, and Tim Conrad. Hybrid pde-ode models for efficient simulation of infection
spread in epidemiology. Proceedings of the Royal Society A: Mathematical, Physical and Engineering Sciences,
481(2306):20240421, 2025. DOI: 10.1098/rspa.2024.0421. - Kristina Kehrer, and Tim O. F. Conrad. A Hybrid ABM-PDE Framework for Real-World Infectious Disease Simulations. Under review. DOI: 10.48550/arXiv.2504.08430.
- S. Müller, S. Paltra, J. Rehmann, K. Nagel, T. O. F. Conrad. (2023) “Explicit Modelling of Antibody Levels for Infectious Disease Simulations in the Context of SARS-CoV-2.” iScience, 26 (9). DOI: 10.1016/j.isci.2023.107554.
- K. Sherratt, A. Srivastava, T. O. F. Conrad, C. Schuette, K. Nagel, Grah et al. (2024) “Characterising information gains and losses when collecting multiple epidemic model outputs.” Epidemics, 47. DOI: 10.1016/j.epidem.2024.100765.
- S. Paltra, T. O. F. Conrad. (2024) “Clinical Effectiveness of Ritonavir-Boosted Nirmatrelvir—A Literature Review.” Adv. Respir. Med. 92(1). DOI: 10.3390/arm92010009.
- P. Dönges, J. Wagner, S. Contreras, E. N. Iftekhar, S. Bauer, S. B. Mohr, J. Dehning, A. C. Valdez, M. Kretzschmar, M. Mäs, K. Nagel, V. Priesemann. (2022) “Interplay between risk perception, behavior, and COVID-19 spread.” Front. Phys. 10:842180. DOI: 10.3389/fphy.2022.842180.
- K. Nagel, C. Rakow, S. A. Müller. (2021) “Realistic agent-based simulation of infection dynamics and percolation.” Physica A: Statistical Mechanics and its Applications, Volume 584, 126322, ISSN 0378-4371. DOI: 10.1016/j.physa.2021.126322.
Selected Pictures
A

B

Selected Pictures
C

Selected Pictures
D

Selected Pictures
E

F
G
Selected Pictures
H
Selected Pictures
A: Number of infectious individuals of full-PDE and hybrid model in rectangular domain for times t ∈ [0,59]. The infectious count decreases with a higher percentage of the ODE domain. This is attributed to the inclusion of the Allee term, which spatially modifies the infection rate in the PDE domain while remaining constant in the ODE domain.
B: Accuracy (mean absolute error) of the full-PDE model and hybrid model in rectangular domain. We can observe an approximately linear growth.
C: Extreme cases of the hybrid model in rectangular domain: the number of infectious individuals is initially equal to the total population number (left) and zero (right). The outcomes for the ODE region appear visually unaffected by the location of the population in the PDE domain, whereas the outcomes for the PDE region vary significantly.
D: Infectious density of PDE model for times t ∈ {1,8,18,60}. Here, the spread can be observed particularly well at the level of home locations.
E: Number of infectious people of full-PDE model (left) and hybrid model (right) in Berlin (simulated and ABM data). The primary reason for the varying number of infectious cases is likely the non-uniform distribution of the population within the PDE domain.
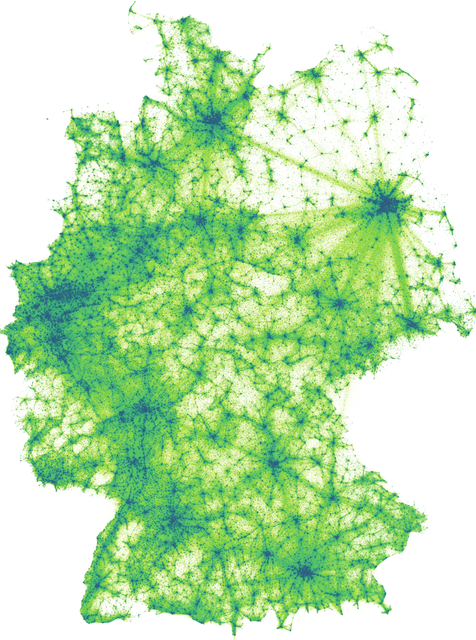
F: Landscape of Germany.
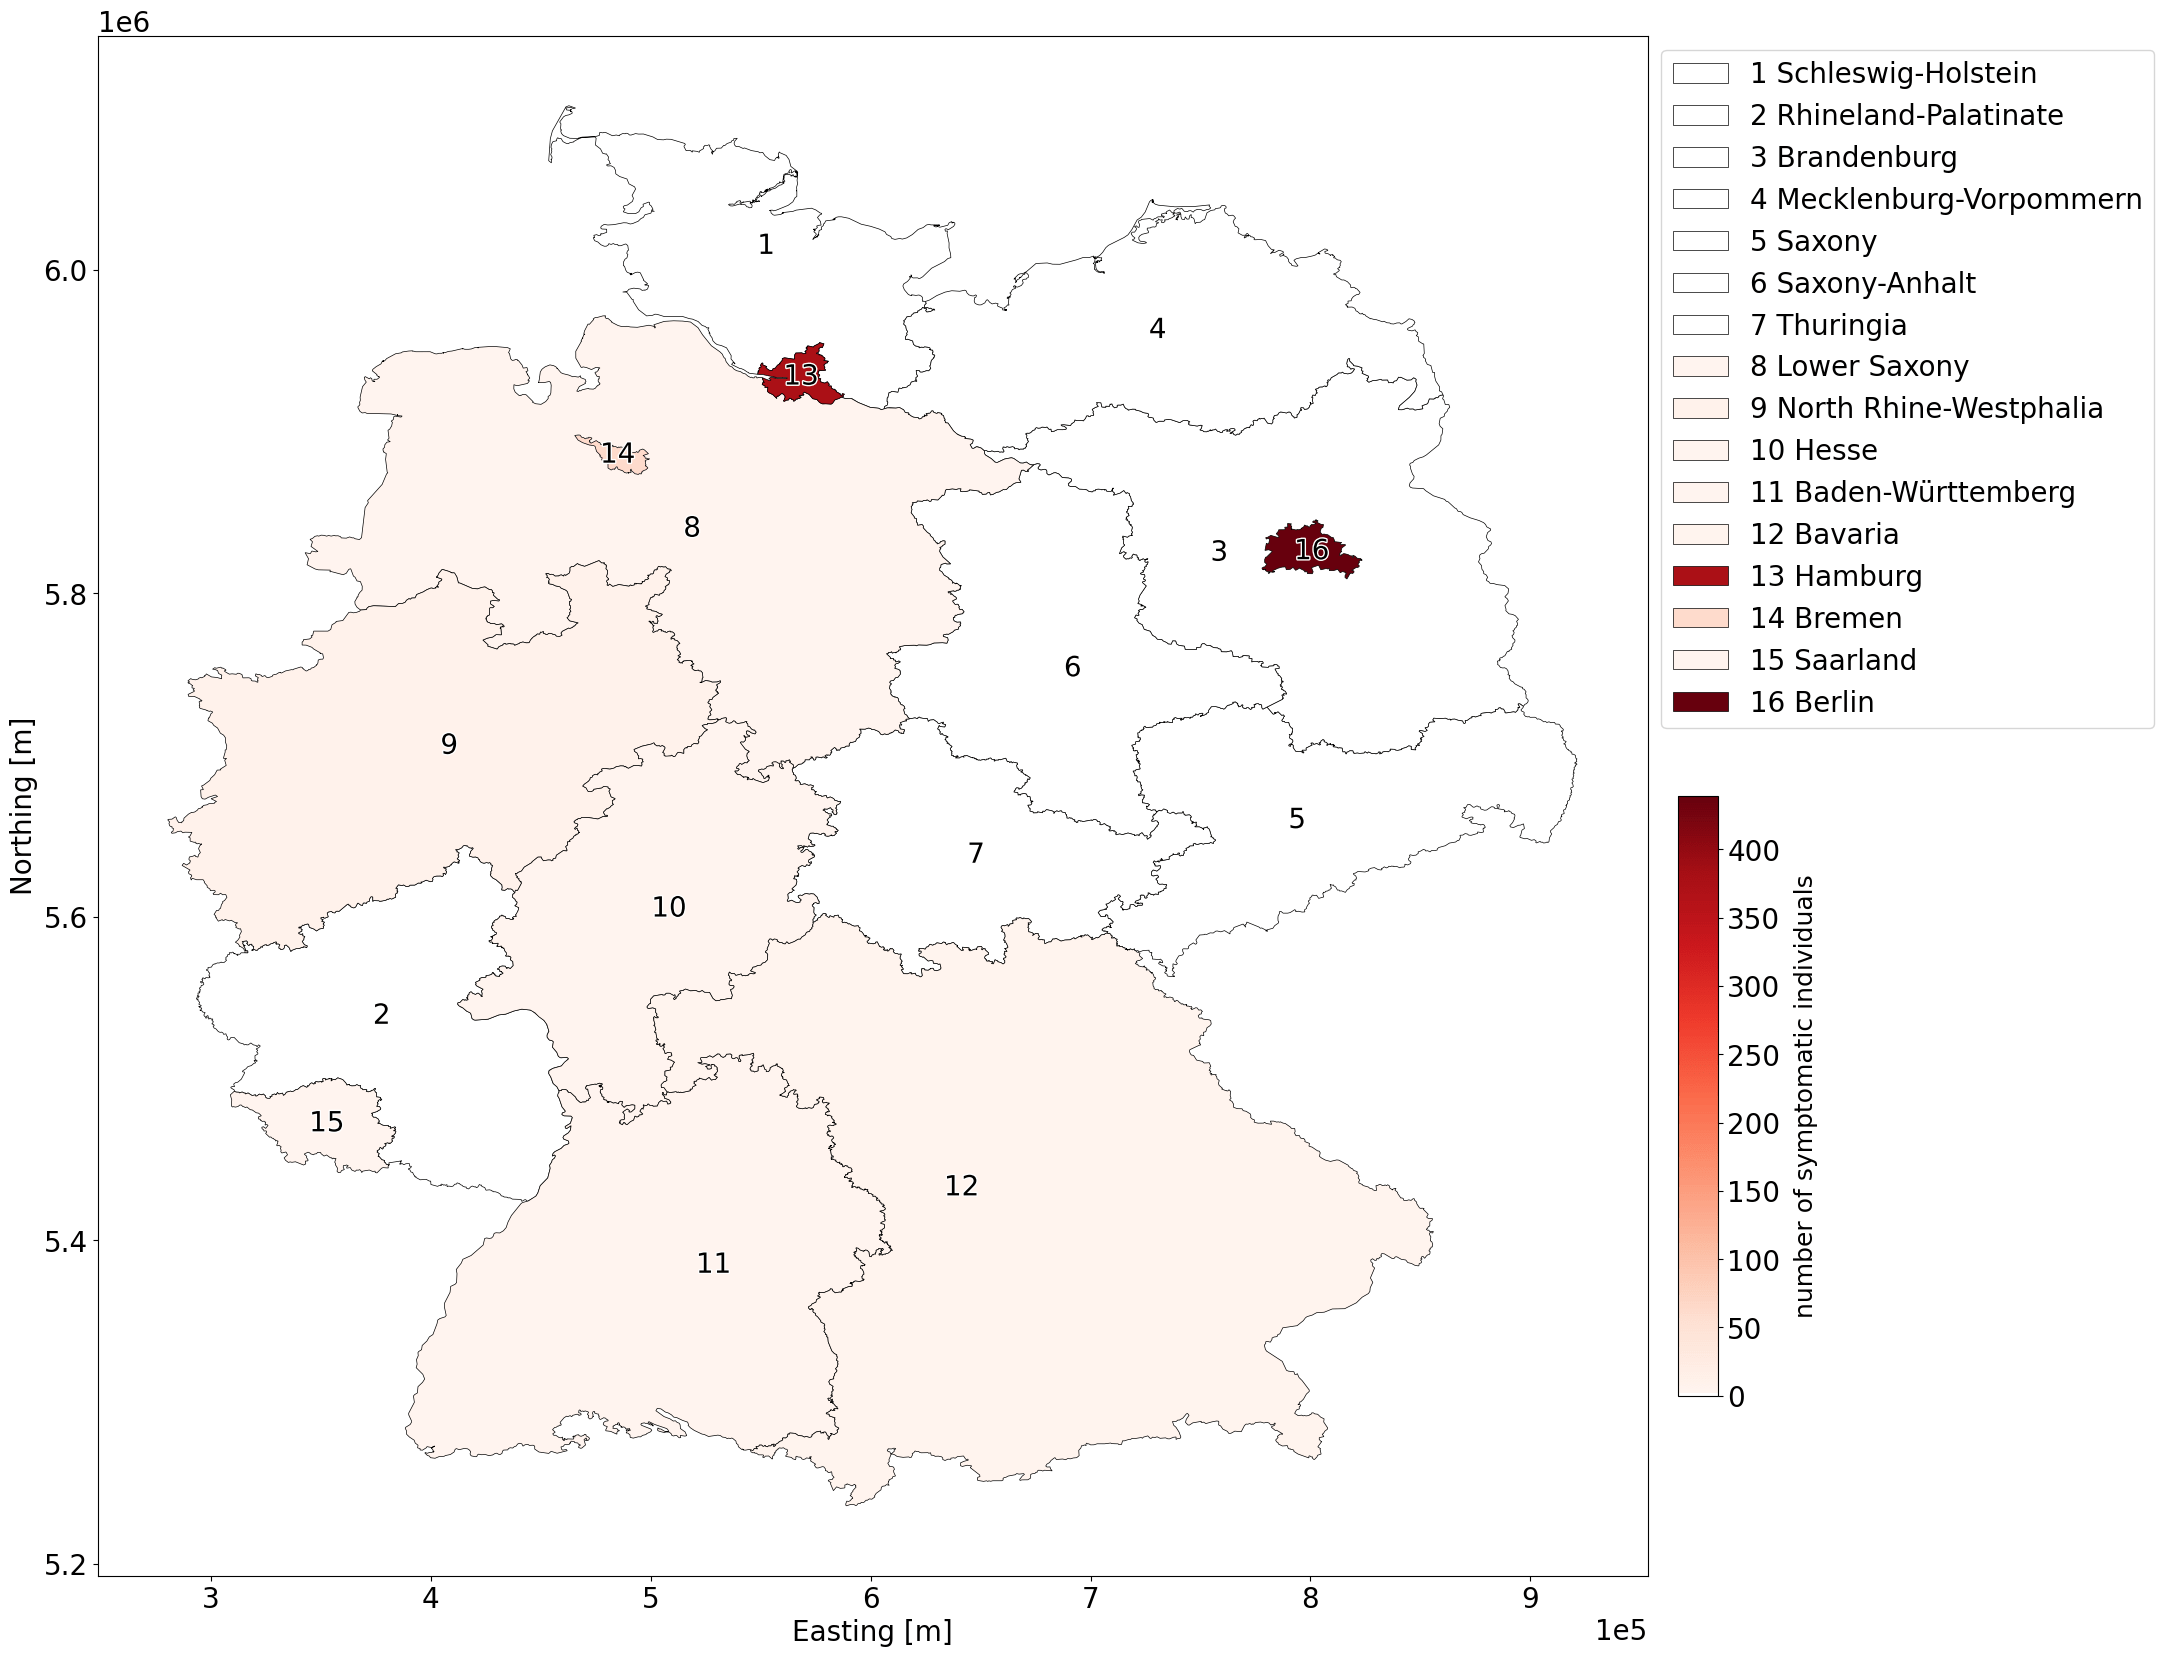
G: Number of symptomatic individuals for each state in Germany.
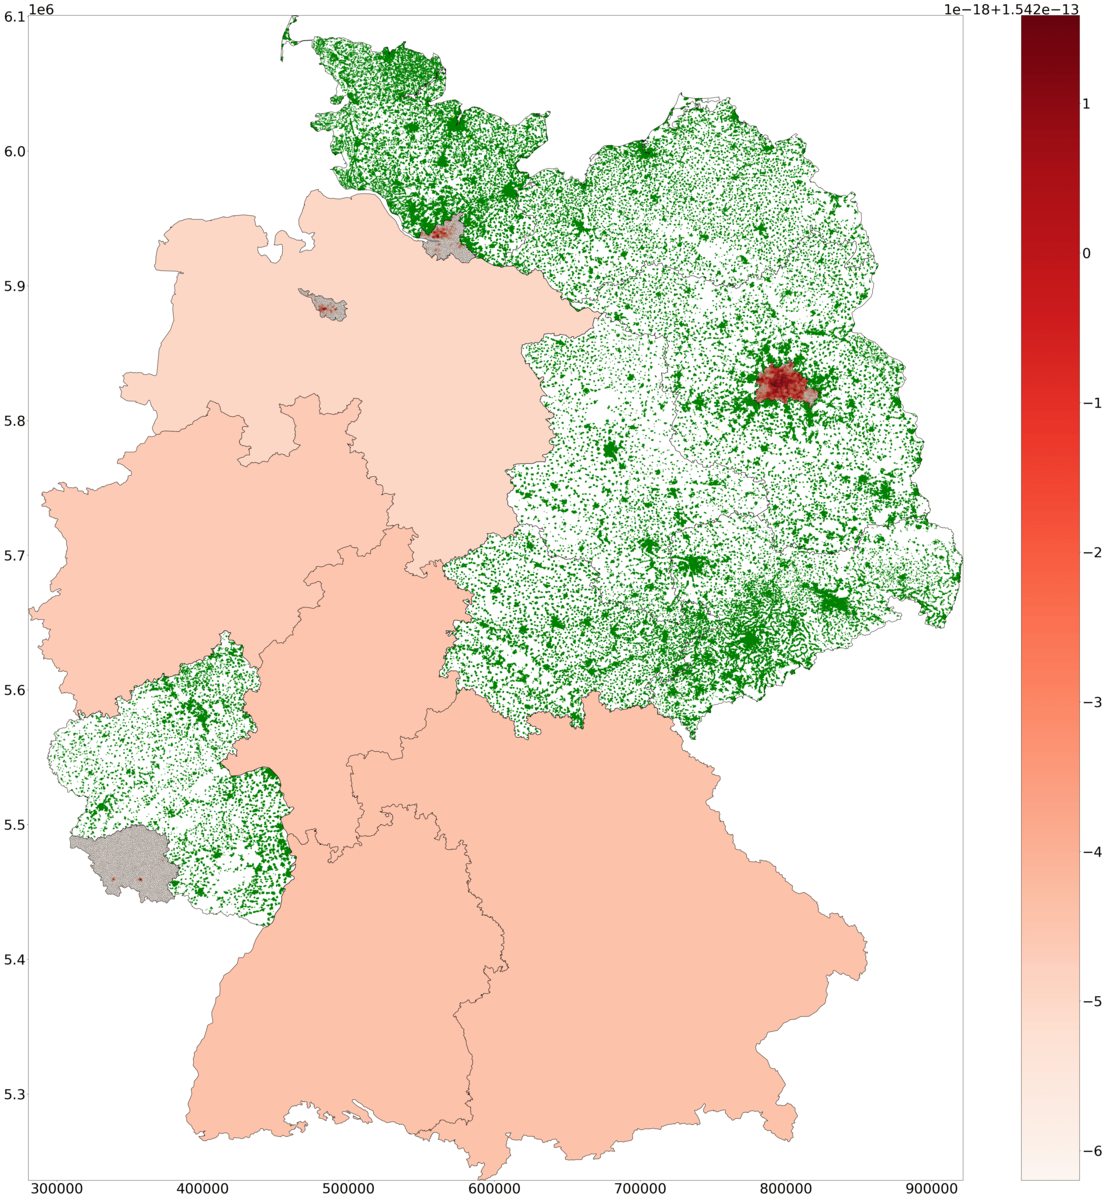
H: Snapshot of symptomatic density in PDE and ODE states, and of agents in ABM states across Germany. The health state of agents is visualized with different colors.
Please insert any kind of pictures (photos, diagramms, simulations, graphics) related to the project in the above right field (Image with Text), by choosing the green plus image on top of the text editor. (You will be directed to the media library where you can add new files.)
(We need pictures for a lot of purposes in different contexts, like posters, scientific reports, flyers, website,…
Please upload pictures that might be just nice to look at, illustrate, explain or summarize your work.)
As Title in the above form please add a copyright.
And please give a short description of the picture and the context in the above textbox.
Don’t forget to press the “Save changes” button at the bottom of the box.
If you want to add more pictures, please use the “clone”-button at the right top of the above grey box.